Florian Heigl
Publish openly

In our cooperation with society and our Citizen Scientists, it is particularly important for us to work as transparently as possible. For us, this also means publishing roadkill reports, developments and scientific articles openly. Open publication means that the reports, developments and results can be found online, are readable, usable and free of charge. We would also like to invite you to participate in the publications, be it through new ideas, critical comments or collaboration in writing the publications.
Roadkill Reports
As soon as a roadkill is reported, it is visible on our interactive map. If you are registered, you can download and use your own reports at any time.
All roadkill reports are checked and can be viewed and downloaded online after a certain processing time. We have described how the reports are reviewed, where they can be found and how they are correctly cited in the dataset section. This data can be used freely if it is stated that it is data from the project Roadkill and is cited correctly. In this way we want to ensure that recognition is guaranteed for all project participants.
Developments
Weekly Reports
At the beginning of each week, we give a brief insight into the previous week's reports in our weekly reports (in German). In this way, we show very promptly which animals are currently being reported, where difficulties have arisen and how many citizen scientists have reported roadkills this week.
Basic analyses
Every three months, we publish an overview of the reported animals of the previous months in order to be able to give quick feedback on what has happened in the project. The basic analyses contain more detailed statistics on how many Citizen Scientists have reported how many roadkills (and which animal groups) and how many protected species (according to IUCN) have been reported in the last three months. Furthermore, these results are compared with the results of the previous basic analyses in order to show seasonal changes. In addition, the basic analyses contain a summary on research topics of the submitted research questions and observations of the past three months.
Annual analyses
The annual analyses will analyse roadkill reports once a year, focusing on detailed information on the surrounding landscapes of the five most frequently reported species and the type of road on which the animals were reported. The surrounding landscape and the type of road (e.g. motorway, interurban) on which roadkills were reported contribute to the understanding of the influence of the landscape and various road features on biodiversity.
In addition, all citizen scientists in the project can vote once a year on which research topics from the past basic analyses they find most attractive. The research topic with the most votes will serve as the basis for a new scientific article. To do this, the underlying questions and observations in the research topic are first refined into a research question by the research team together with the submitters. This research question will then be worked on and developed into a scientific article. We invite you to participate in the whole process according to your possibilities and time resources.
Scientific article
All scientific articles that we write in the project team on the basis of the reports in the project Roadkill are published in the public domain. This means that no one has to pay to read the results from the project. This may sound a bit strange, but it is quite common to have to pay about 50€ to publishers to be able to read a scientific article. In order to be able to publish articles in an open way in reputable journals, so that readers don't have to pay anything for them, authors have to pay between several hundred and several thousand euros per article. However, since these articles are usually written in English, in technical language and therefore may be difficult to understand, there is also a German, easy-to-understand summary of each publication on the project website.
Analyse roadkills
Where are animals reported?
When you open our project website or the apps, the map with the many spots jumps out at you. The map is automatically set to a certain area. On the website, for example, you can see a section of Europe, and in the app you can zoom in to the respective location. Whether on the website or in the apps, the map can be zoomed in and out as desired to get either a worldwide overview of where animals are reported, or you can search for a single municipality or a specific street to see which animals have been reported there. The zoom function can be controlled on a computer using the mouse, the trackpad or the buttons at the bottom right of the map. On a smartphone, you zoom in and out by placing two fingers on the map and dragging them apart or together.
As you move through the map, you can see the spots loading. If you zoom out of the map, individual spots stack up to maintain an overview. If you zoom into the map, the stacks split up again. Clicking on a stack also enlarges the map and splits the stack. The following screen record shows what this looks like.
When are animals reported?
There are three very helpful tools to answer this question.
- View the most recent spots.
- The timeline.
- The heatmap.
View the most recent spots
Let's first look at the latest spots. This tool can be found in the grey menu bar by clicking on the " Watch" symbol. Here you can immediately see which animals were last reported by which citizen scientists. Clicking on a spot immediately moves the map to the right to the location where the spot was found, and there you can select the spot, you can comment, share and like it.
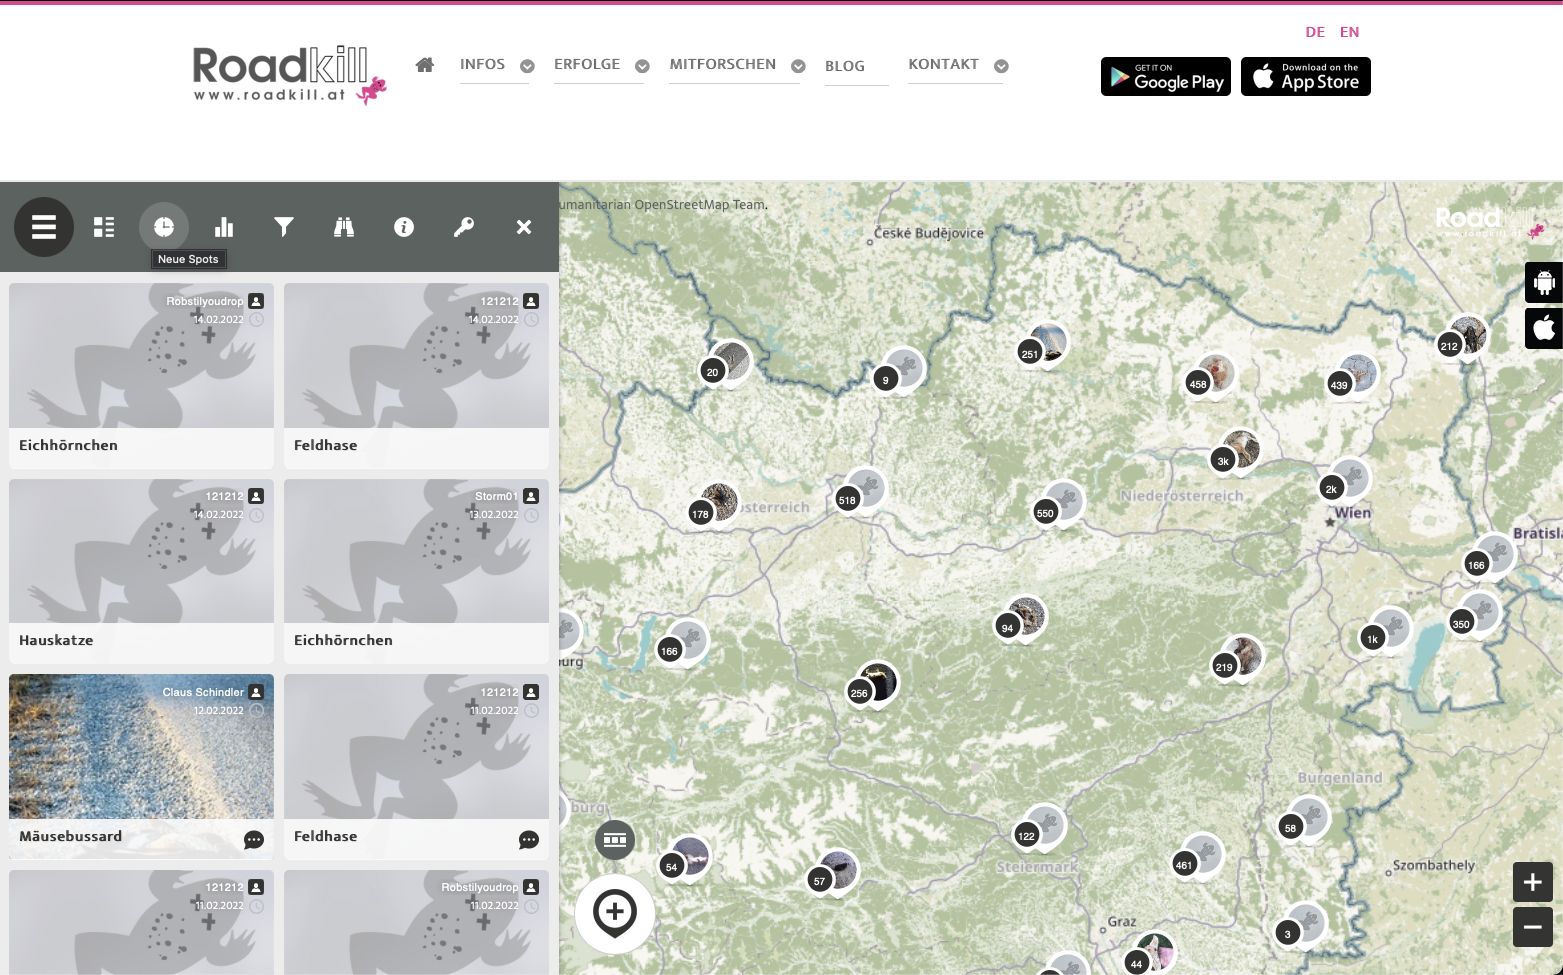
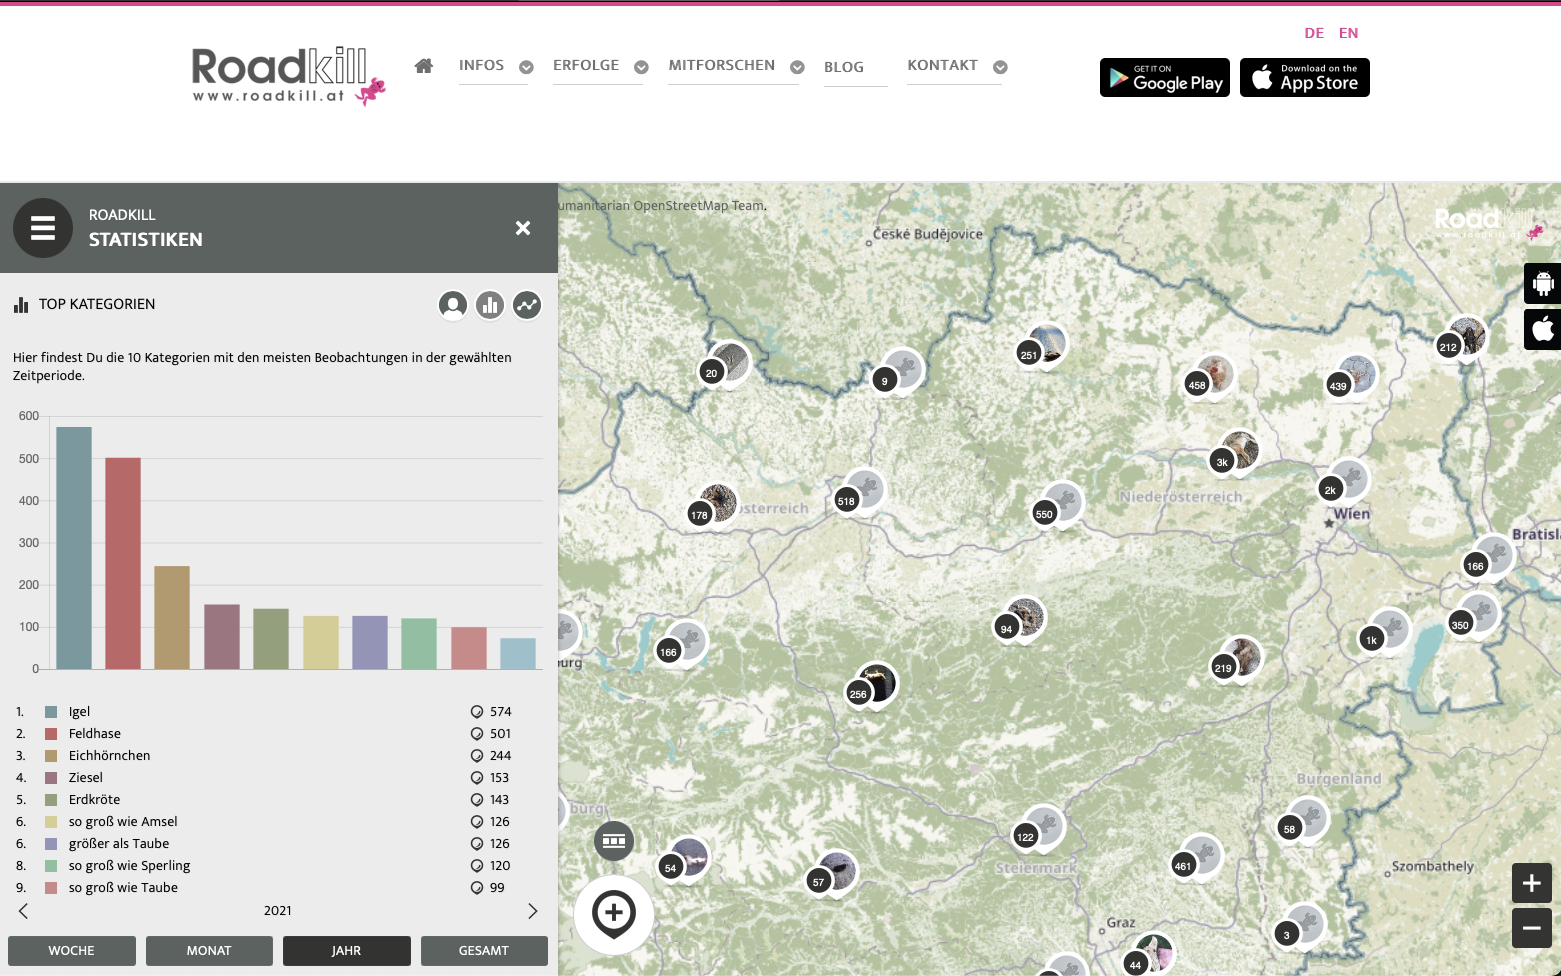
The timeline
The timeline is also located in the grey menu bar, but right next to the icon with the latest spots, under the icon that looks like a bar chart. Here you will find all the statistics that we will describe below.
If you now click on the symbol with the bar chart, a new menu appears on the right in the white area, which consists of three circles. We first look at the rightmost circle with the line. This is where the timeline is hidden. In this area we see a line diagram with several coloured lines, each line reflecting an animal group. The diagram is structured in such a way that the x-axis (the lower bar) shows the course of time and the y-axis (the side bar) shows the number of animals reported. Here you can also set which groups of animals you want to see and which time periods you want to see. In the screen record below we show you exactly how to do this. In the yearly setting, you can see how the number of reports increases in spring and decreases again in late autumn.
The heat map
The heat map can be found in the online map and in the app via the small grey symbol with the three squares and two bars in the map. In the screenshot above you can see it directly above the "Add Spot" symbol. If you click on it, the map changes and you can see by colour where the most animals have been reported (red), where less (orange/yellow) and where none at all (in grey). In the following video we show how to use this heat map.
The heatmap feature was developed with the support of the Austrian Science Fund (FWF) [PUD 19-B].
![]()
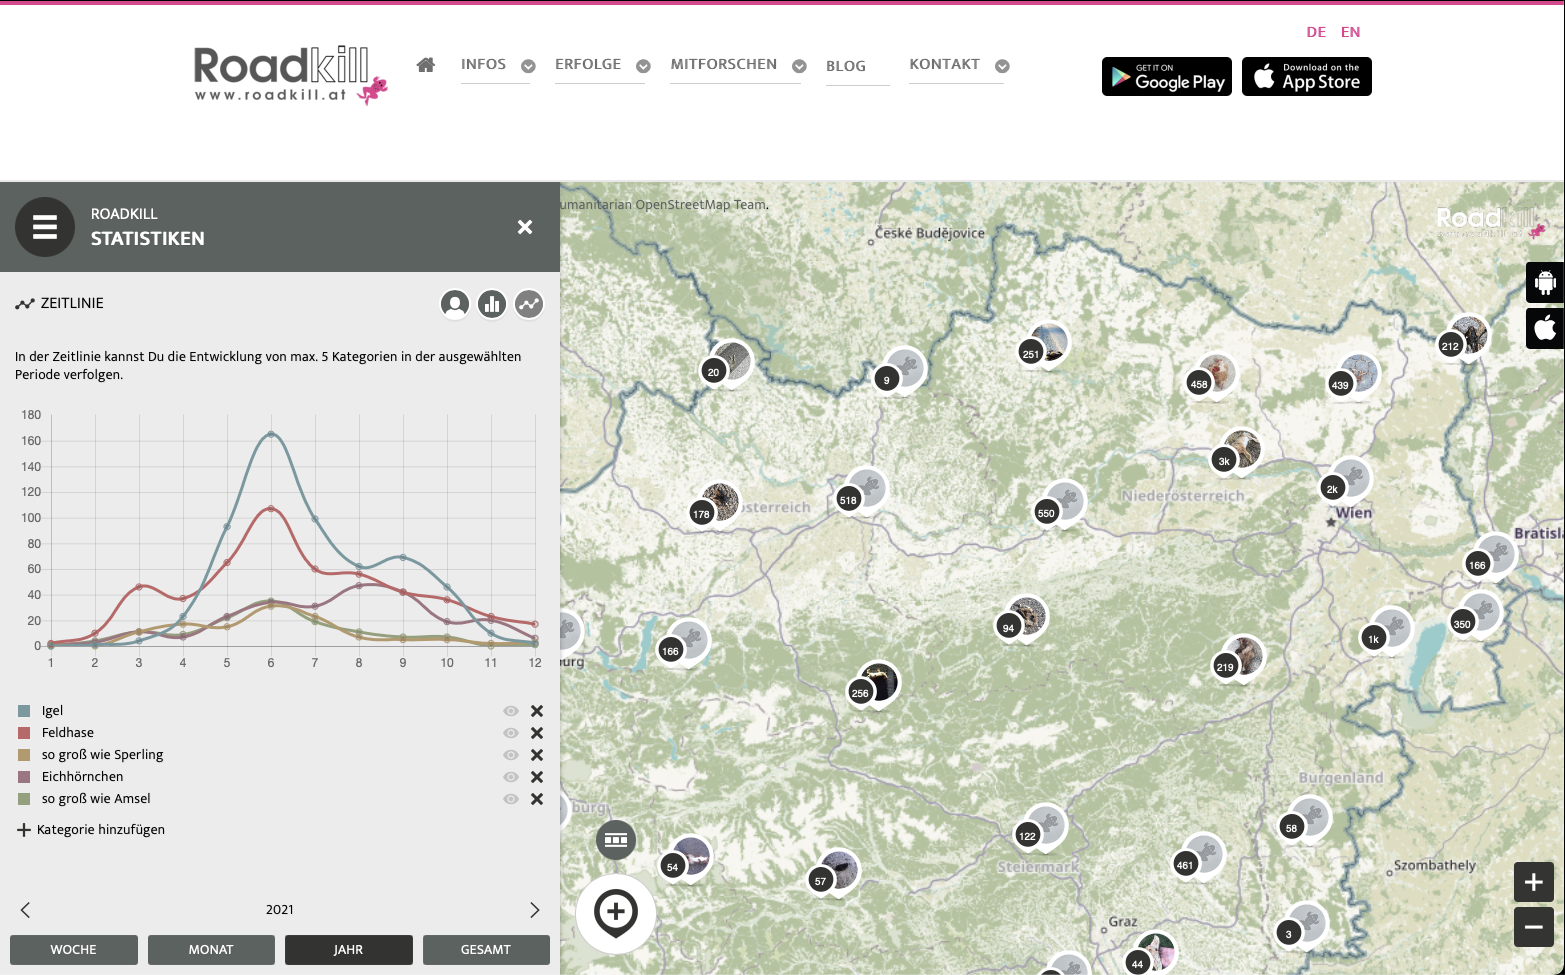
How many animals are reported?
The quickest overview of how many animals are reported can be found in the second submenu of the statistics under the menu circle with the bar chart in the middle. Here you can see the ten most frequently reported animal groups per period selected below.
In addition, you can of course also see in the map itself how many animals were reported in which space. The total number is displayed automatically. If you want to see a selected animal group, you can use the filter, which can be found in the main menu under the "funnel" symbol. If you select an animal group here, the spots on the map are filtered according to it.
Screen recordings:
What interests you most?
We would like to encourage you to use the statistics and "play with the numbers". Feel free to write us your observations, thoughts and research questions via "Ask a research question". We look forward to it!
Check roadkills

Citizen Scientists can immediately see any report on our online map (in German) and can helpt us to check the reports.
On the one hand, you can indicate directly under the photo of the animal whether the spot is correct. By clicking on the tick or the cross you can help to speed up the verification of the reports and at the same time give quick feedback to the citizen scientists whether their entry is correct.
If there is any ambiguity, you can also comment, e.g. if a report has not been drawn on a road, the animal has been incorrectly identified or it may not be a roadkill at all. If there is something you notice about a report, we invite you to note it in a polite and appreciative comment.
How can you comment?
To comment on a report, you must first log in. On our online map or in the app, please click on a report. The complete report will appear immediately on the left-hand side of the online map or in the lower section of the app. At the very bottom of this area you will find the "Comments" field. Here you can leave your comment or give other comments a "heart" if you support them. Of course, you are also welcome to reply to others' comments and thus start an appreciative discussion.
The Roadkill Community looks forward to your views and expertise if you would like to share them with us. You are also welcome to ask questions about the reports.
We in the project team also look at each report and check it. If the report is plausible, the report is marked with a green tick and can no longer be changed. This is important because further analyses are based on these reports and changing the data afterwards would make the results no longer comprehensible.
Why join the research?
Ask a research question
In the Ask a Research Question section, we collect all the questions, sort them, develop them into research topics, and then release them for voting so that we can decide together in the community which topics will be researched further. We invite everyone to participate in the voting and also to collaborate in the following steps as we work on research topics and move forward together to a publication, creating new knowledge.
So you can see that your question can potentially be very important in advancing research on roadkills. Your ideas provide new impetus and are valuable to the scientific community. In this way, we would like to bring your local expertise to the development of the project and thus conduct research that is supported by the community.
Report Roadkills
At the heart of the Roadkill project are reports of roadkill using apps or online forms. The reports are made by Citizen Scientists who see roadkill animals on their daily routes and report them. It is important that only vertebrates that have clearly been killed by road traffic are reported.
All questions and analyses in the project are based on your reports. This means that your reports are used in scientific studies on the one hand, but on the other hand they are also available for our cooperation partners to derive possible conservation measures.
Check roadkills
You can see every report immediately on our online map and can help us to check it.
On the one hand, you can indicate directly under the photo of the animal whether the spot is correct. By clicking on the tick or the cross you can help to speed up the verification of the reports and at the same time give quick feedback to the citizen scientists whether their entry is correct.
If there is any ambiguity, you can also comment, e.g. if a report was not drawn on a road, the animal was wrongly identified or it might not be a roadkill at all. If you notice something about a report, we invite you to comment on it in a polite and appreciative manner directly with the report. This way you help to keep the quality of the reports on a high level.
In the project, people with different knowledge help together. For example, if you are particularly knowledgeable about mammals, we invite you to help others in the community identify mammals by commenting on mammal reports. This way you can share your knowledge and other Citizen Scientists will learn through you what animals they have found.
Analyse Roadkills
All reports are displayed in our online map. This online map includes in the app, but also on the website, numerous functions to sort, filter and analyze the reports according to your own preferences. You can find out exactly which options are available and how to use them in the Analyse Roadkills section.
On the one hand, these functions allow you to dive deeper into the project, to deal with the topic of roadkill more intensively, or simply to explore the previous reports out of interest. If you come up with ideas for new questions during your analysis or if you discover regularities or correlations in the reports, we invite you to report them to us via our form. Your ideas will help advance the research on roadkills.
Publish openly
In our project it is very important to us to work transparently. Therefore, all results are made freely available. For example, you will receive weekly updates in German on the status of reports, every three months we publish our newsletter and a summary of the results in the basic analyses, and once a year we analyze the roadkill reports, focusing on detailed information about the surrounding landscapes of the five most frequently reported species and the type of road on which the animals were reported. Of course, all of our scientific articles are also made freely available and additionally summarized in German on our website. This way, you will be extensively informed about which steps and results were made possible with your contribution. As described in the section Publish Openly, we also invite you to participate in the publication process with your ideas, comments and critical remarks.
You are also welcome to follow our blog on Österreich forscht in German to be informed about news.
Dataset
The data on roadkills is the heart of the project and was collected through the voluntary work of the participating citizen scientists. Therefore, it is a concern for us in the project team to give back to society as much as possible from the project. Moreover, as part of the listing on the platform Österreich forscht, we have committed ourselves to fulfilling the quality criteria for citizen science projects that apply there, which include, among other things, that results and data from a citizen science project must be made freely available.
As soon as a roadkill is reported, it is visible on our interactive map. You can filter by species on this map, create a so-called heatmap where you can see clustering points of reported animals and also create time series. This way you can get a first overview of which animals are reported where and when in the project. Each participant can download and use his/her own reports at any time.
Every second day, the data entered into the Roadkill project is validated by members of the project team to correct incorrect or inconsistent entries via the backend of the website or, if the record cannot be corrected, the record is deleted. Correction of data was done (i) by the project team itself if errors were obvious (e.g., animal in submitted image does not match species identification listed) or (ii) by the participants themselves after being advised by the project team that a correction was needed (e.g., roadkill is not on a road). Since the participants collected the data during their daily routine, the data presented are so-called presence data.
To ensure the quality of the data, we used a stepwise selection process that allowed us to classify the submitted data into three quality levels at the end of this process:
- Quality level 1: Data sets with correct animal identification (either by experts or by images) and consistent data.
- Quality level 2: Data sets with consistent data but no possible validation of the animal.
- Deleted: records with inconsistent data and no possible validation of the animal.
We thank all the citizen scientists who reported the data and helped identify the animals. Without the many volunteer efforts of the citizen scientists, this project would not be possible.
Please note that if you use the data and a publication from it, you must indicate where these data come from. Therefore, please cite accordingly.
Quality level 1 data
All quality level 1 data can be viewed and downloaded on GBIF: https://www.gbif.org/dataset/d0d5ef85-71b2-4da6-b6f6-c1c3d60987d3
Please cite as: University of Natural Resources and Life Sciences, Vienna. Roadkill. Occurrence dataset https://doi.org/10.15468/ejb47y accessed via GBIF.org on xxxx.
Quality level 2 data
All quality level 2 data can be viewed and downloaded on Zenodo: https://zenodo.org/communities/roadkill_dataset_quality_level_2/?page=1&size=20
Please cite as: Heigl, Florian, & Roadkill Community. (2022). Roadkill Dataset 2014-2020 Quality level 2 [Data set]. Zenodo. https://doi.org/10.5281/zenodo.5878813
Personal data will of course not be made available.
Description of the data from 2014-2020:
Decrease in roadkill reports during first COVID-19 lockdown
The first coronalockdown in spring 2020 also affected the roadkill project, as our just published paper in the journal PeerJ shows. In particular, roadkills of those animals that became active again after hibernation were reported significantly less than in previous years. But is this because fewer animals were actually roadkilled, or because of the reduced mobility of citizen scientists in the project? To find out, we did a survey of the Austrian citizen scientists in the project and found that a majority of respondents said they felt they had reported fewer roadkills, whether or not their mobility behavior had changed during the lockdown. Combined with traffic data from other sources, the results suggest that perhaps fewer animals were actually hit. What is quite certain, however, is that citizen science projects in general, when analyzing data from this period, need to be aware that the lockdown may have had a significant impact on their data in some cases, and this needs to be taken into account when interpreting it.
Background
The global COVID-19 pandemic is affecting human activities and lives as never before in our lifetime. To avoid the unnecessary deaths of thousands of people due to the excessive demands on our healthcare systems (Anderson et al., 2020), most governments around the world have taken strict measures to reduce infection rates in the population (WHO, 2020). In Europe, curfews or strict restrictions on leaving the house or apartment were in place for many people in spring 2020 (Hale et al., 2020). Activities were reduced to necessary services such as transportation and the sale of food or medicine (Hale et al., 2020). Austria was among the first countries in Europe to introduce strict curfew restrictions on leaving one's home starting in mid-March 2020, specifically from March 16 to April 14 (Hale et al., 2020). During this period, people living in Austria were only allowed to leave the house for five reasons: (i) to go to work if in a systemic occupation (e.g., supermarkets or pharmacies), (ii) to buy groceries or medicines, (iii) to help others who could not care for themselves, (iv) to take a short walk outside, always keeping a minimum distance of one meter from other people, and (v) to save one's own life in case of a life-threatening event (e.g., fire) in the home (Republic of Austria, 2020). This meant that many people worked from home, reduced their working hours, or lost their jobs, minimizing activities or travel around the country (Poledna et al., 2020).
This reduction in human activity in Austria, as well as in several other countries, has had ecological impacts, such as improved air quality due to a dramatic decrease in industrial activities and traffic (Zambrano-Monserrate, Ruano & Sanchez-Alcalde, 2020). In addition, many reports of "nature's recovery" during curfews have been shared in the media and social media around the world, showing wildlife in populated areas (Rutz et al., 2020; Bar, 2020). However, Helm (2020) noted that evidence of the direct effects of COVID-19 restrictions on wildlife and environmental protection, including the effects of reduced road traffic on the number of animals roadkill, is largely anecdotal to date and based on expected impacts rather than new data.
Based on citizen participation in data collection, an influence of COVID-19 curfews on roadkill reported in roadkill projects was also suggested:
- In the U.S., a decrease in wildlife-vehicle collisions was reported in California, Idaho, and Maine following government orders to stay home (Shilling et al., 2021).
- In Australia, a study reported a 48% decrease in the number of animals run over during exit restrictions in April 2020 on an 18-km stretch of road that has been surveyed regularly over the past five years (Driessen, 2021).
- Łopucki et al. (2021) observed a 50% decrease in hedgehogs killed on the road in the city of Chelm (Poland) during exit restrictions compared to the previous two years.
- In addition, a recent study showed a decrease in the number of hedgehogs killed in 11, mostly European, countries (Bíl et al., 2021), although Austria was not studied. However, after the end of baseline restrictions, hedgehog roadkill numbers increased back to previous levels.
What all of these studies have in common is that they rely on data that could be consistently collected even during curfew periods (e.g., police reports, professional monitoring, carcass removal), but not on citizen science data. In one study, citizen science data were even excluded from analyses because of the potentially high impact of curfew restrictions (Bíl et al., 2021). It is therefore crucial to understand what kind of impact curfews also have on citizen science data in order to avoid potential biases or interpretation errors.
In Austria, the Roadkill project has been ongoing since 2013. The aim of the project is to minimize the number of animals run over in Austria. To this end, the influences of traffic and the landscape around roads on vertebrates are being studied. The project is in its first phase, which aims to obtain an overview of the number and distribution of roadkills using Citizen Science (Heigl et al., 2017; Bíl et al., 2020). As part of the project, citizen scientists report roadkill animals they discover on roads via apps for Android or iOS or via the project's website (www.roadkill.at/en).
Participants mainly report from suburbs and higher-profile roads (Heigl et al., 2016). The citizen science approach has therefore proven to be well suited to study roadkills (Shilling, Perkins & Collinson, 2015; Heigl et al., 2017; Chyn et al., 2019; Yue, Bonebrake & Gibson, 2019; Bíl et al., 2020; Englefield et al., 2020), as citizens travel long distances on roads on a daily basis (e.g., bicycling as a hobby or commuting to work). Therefore, we immediately saw a decrease in roadkill reports during the COVID-19 spring curfews compared to previous years (Fig. 1).
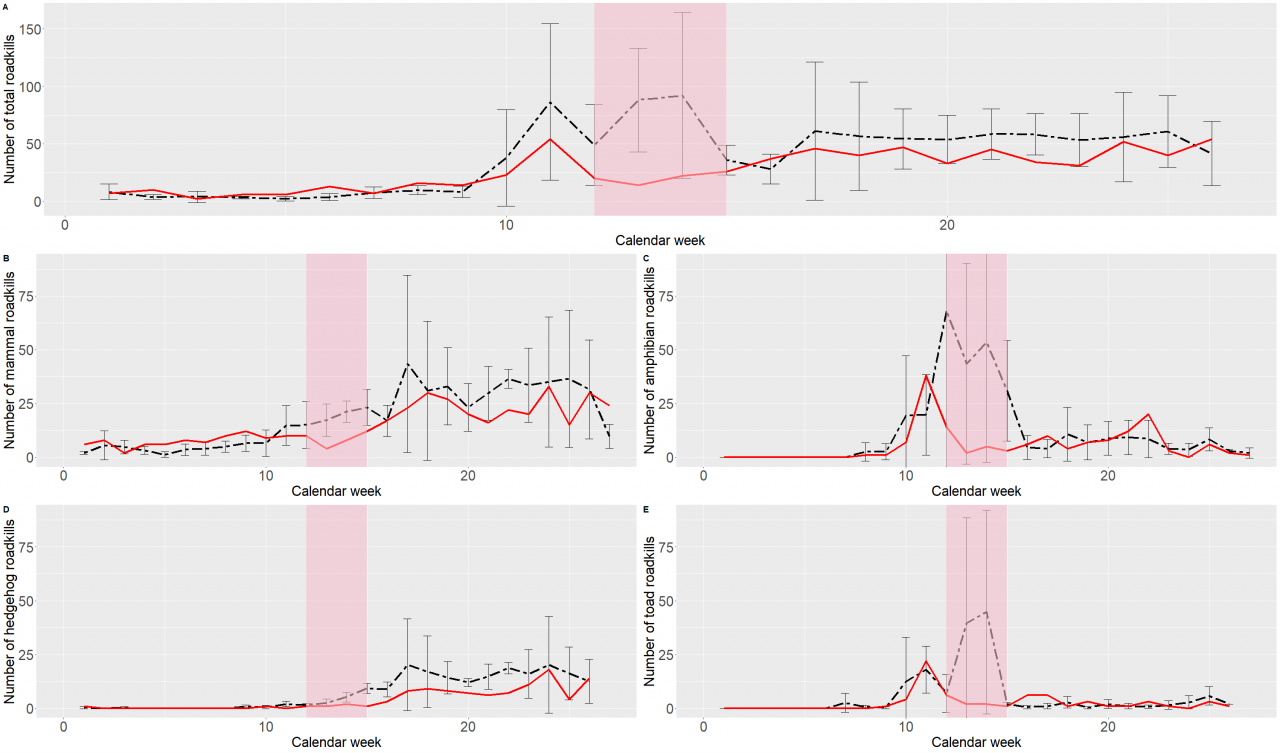
Fig 1: Comparison of the average number of roadkills from 2016 to 2019 (black dashed line) with the number of reported roadkills from 2020 (red line). Severe lockdown measures were effective in calendar weeks 12 through 15 (indicated by the red highlighted area), with gradual relaxation in subsequent weeks. Error bars are shown for 2016-2019. (A) Total number of roadkills reported. (B) Number of reported roadkills of mammals.(C) Number of reported roadkills of amphibians. (D) Number of reported roadkills of hedgehogs (Erinacaeus sp.). (E) Number of reported roadkills of common toads (Bufo bufo).
Observations in spring 2020
In previous years, the number of reported roadkills increased for many species in the spring due to the migration of these animals to their spawning grounds (e.g., common toad) or because of foraging (e.g., hedgehog) after hibernation. The overall increase in the number of reports of roadkill was less pronounced in the spring of 2020 than in the spring seasons of previous years. However, at this time we did not know if this decrease was due to fewer animals being killed on the roads due to reduced traffic. Another explanation could be that project participants were on the roads less and therefore could not report the same number of roadkills as before, even though the number of roadkills themselves had remained unchanged. The challenge of teasing out the sociological factors that influence the data collected in ecological citizen science projects is well known and has been studied many times. For example, we know that some projects experience data bias on weekends (Courter et al., 2013; Cooper, 2014) because citizen scientists have more time to collect data on weekends, or that data are more often reported near settlements or roads (Johnston et al., 2020) because many people are traveling in those areas. However, the behavioral changes induced by curfews are unique and need to be studied in detail to understand how these changes affect ecological data collected in citizen science projects.
Therefore, the goal of our study was to investigate how the strict restriction on leaving one's home in Austria during the first COVID-19 lockdown in spring 2020 affects data collection in the Roadkill project. We tested the hypothesis that the decrease in roadkill reports was due to a change in mobility behavior among our participants by conducting a survey of Austrian project participants. The results of this survey will have implications for further analyses of the data collected during the closure, not only in Project Roadkill, but in all citizen science projects that rely on opportunistic ecological data collection.
Results
A total of 77 people responded to the survey. Nearly two-thirds (64%) reported that they felt they reported fewer roadkills than before the curfew, 32% reported the same number of roadkills, and only 4% felt they reported more roadkills than before.
When asked if anything had changed in the way respondents moved on the roads, more than two-thirds (69%) indicated that the frequency with which they moved on the roads had changed, compared to 31% who indicated that they moved with the same frequency as before. In addition, more than half of respondents (55%) indicated that the length of their routes has changed, while 45% indicated that the length of their routes has not changed at all. However, routes have not changed for most respondents (75%), nor have the types of roads used (77%). The type of transportation they used to travel on the roads also did not change for most respondents (68%).
To test our hypothesis that the decrease in reports of roadkills was due to a change in mobility behavior among our participants, we compared the responses of respondents for whom there had been no change in the frequency of their trips, the length of the trip, the type of road, or the type of transportation mode used with the responses of those people for whom there had been some change in mobility behavior due to the curfew. Here we found no differences between the two groups, i.e., a majority of both groups reported feeling fewer roadkills.
Further analysis revealed that reducing the length of time people traveled on roads and reducing the frequency with which they traveled were the only factors that influenced the number of roadkills reported by participants. Respondents who estimated that they reported more roadkills than in the past overwhelmingly indicated that they either traveled longer distances or that the length of their routes did not change at all or that they traveled more often. However, only 3 respondents overall reported more roadkills than before the lockdown. Translated with www.DeepL.com/Translator (free version)

Conclusions
Responses indicate that routes, types of roads used, and types of transportation used have not changed for the majority of respondents. All three questions about these potential effects of curfews were answered negatively by at least a two-thirds majority. Consequently, we also found no significant impact of these issues on the estimated number of roadkills reported. In addition, those who felt they reported more roadkills than before the lockdown did not note any change in routes, roads used, or mode of transportation.
COVID-19 clearly had an impact on Project Roadkill and its participants. The number of reported roadkills in 2020 decreased significantly during the lockdown weeks compared to the average number of reported roadkills in 2016-2019. In previous years, there were two peaks in the spring when many roadkills were reported. In 2020, the first peak was less pronounced, and the second peak was absent altogether. Two explanations are possible for this, although we think the second is more likely. First, the lockdown measures meant that data were not reported primarily from those animals that become active in early spring after hibernation, such as many amphibians or mammals (e.g., hedgehogs), due to the reduced activities of our citizen scientists. Second, our results suggest that the overall number of animals killed may have decreased due to reduced vehicle traffic on roads during the lockdown. In addition, frequency of use and length of distance traveled appear to be the primary factors in a decrease in roadkill reports. We also found that the majority of respondents saw fewer roadkills than usual. The survey demonstrates the duality of project roadkill. When there are fewer project participants on the roads and this is representative of society, on the one hand, reports to the project decrease, but on the other hand, the negative impacts of roadkill on vertebrates also decrease.
Our study indicates that future data analyses based on citizen science projects should take into account the possibly changed reporting behavior of citizen scientists during the COVID pandemic to avoid false ecological conclusions.
The entire study can also be downloaded for free on PeerJ's site:
2021. A decrease in reports on road-killed animals based on citizen science during COVID-19 lockdown. PeerJ 9:e12464 https://doi.org/10.7717/peerj.12464
References
Anderson RM, Heesterbeek H, Klinkenberg D, Hollingsworth TD. 2020. How will country-based mitigation measures influence the course of the COVID-19 epidemic? The Lancet 395(10228):931-934
Bar H. 2020. COVID-19 lockdown: animal life, ecosystem and atmospheric environment. Environment, Development and Sustainability 23(6):8161-8178
Bíl M, Andrášik R, Cícha V, Arnon A, Kruuse M, Langbein J, Náhlik A, Niemi M, Pokorny B, Colino-Rabanal VJ+2 more. 2021. COVID-19 related travel restrictions prevented numerous wildlife deaths on roads: a comparative analysis of results from 11 countries. Biological Conservation 109076(2):109076
Bíl M, Heigl F, Janoška Z, Vercayie D, Perkins SE. 2020. Benefits and challenges of collaborating with volunteers: examples from national wildlife roadkill reporting systems in Europe. Journal for Nature Conservation 54(1):125798
Chyn K, Lin TE, Chen YK, Chen CY, Fitzgerald LA. 2019. The magnitude of roadkill in Taiwan: patterns and consequences revealed by citizen science. Biological Conservation 237(3):317-326
Cooper CB. 2014. Is there a weekend bias in clutch-initiation dates from citizen science? Implications for studies of avian breeding phenology. International Journal of Biometeorology 58(7):1415-1419
Courter JR, Johnson RJ, Stuyck CM, Lang BA, Kaiser EW. 2013. Weekend bias in citizen science data reporting: implications for phenology studies. International Journal of Biometeorology 57(5):715-720
Driessen MM. 2021. COVID-19 restrictions provide a brief respite from the wildlife roadkill toll. Biological Conservation 256:109012
Englefield B, Starling M, Wilson B, Roder C, McGreevy P. 2020. The Australian roadkill reporting project—applying integrated professional research and citizen science to monitor and mitigate roadkill in Australia. Animals 10(7):1-20
Hale T, Angrist N, Cameron-Blake E, Hallas L, Kira B, Majumdar S, Petherick A, Philips T, Tatlow H, Webster S. 2020. Oxford COVID-19 government response tracker.
Heigl F, Horvath K, Laaha G, Zaller JG. 2017. Amphibian and reptile road-kills on tertiary roads in relation to landscape structure: using a citizen science approach with open-access land cover data. BMC Ecology 17(1):24
Helm D. 2020. The environmental impacts of the coronavirus. Environmental and Resource Economics 76(1):21-38
Johnston A, Moran N, Musgrove A, Fink D, Baillie SR. 2020. Estimating species distributions from spatially biased citizen science data. Ecological Modelling 422:108927
Łopucki R, Kitowski I, Perlińska-Teresiak M, Klich D. 2021. How is wildlife affected by the covid-19 pandemic? Lockdown effect on the road mortality of hedgehogs. Animals 11(3):1-8
Poledna S, Rovenskaya E, Cuaresma JC, Kaniovski S, Miess M. 2020. Recovery of the Austrian economy following the COVID-19 crisis can take up to three years. IIASA Policy Brief. 26
Republik Österreich. 2020. 98. Verordnung des Bundesministers für Soziales, Gesundheit, Pflege und Konsumentenschutz gemäß §2 Z1 des COVID-19-Maßnahmengesetzes.
Rutz C, Loretto MC, Bates AE, Davidson SC, Duarte CM, Jetz W, Johnson M, Kato A, Kays R, Mueller T+5 more. 2020. COVID-19 lockdown allows researchers to quantify the effects of human activity on wildlife. Nature Ecology and Evolution 4(9):1156-1159 WHO. 2020. Overview of public health and social measures in the context of COVID-19. In: World Health Organization 2020.
Shilling F, Nguyen T, Saleh M, Kyaw MK, Tapia K, Trujillo G, Bejarano M, Waetjen D, Peterson J, Kalisz G+3 more. 2021. A reprieve from US wildlife mortality on roads during the COVID-19 pandemic. Biological Conservation 256(3):109013
Shilling F, Perkins SE, Collinson W. 2015. Wildlife/roadkill observation and reporting systems. In: Handbook of Road Ecology. Hoboken: Wiley. 492-501
Yue S, Bonebrake TC, Gibson L. 2019. Informing snake roadkill mitigation strategies in Taiwan using citizen science. Journal of Wildlife Management 83(1):80-88
Zambrano-Monserrate MA, Ruano MA, Sanchez-Alcalde L. 2020. Indirect effects of COVID-19 on the environment. Science of the Total Environment 728:138813
Sixth scientific article: Frogs migrate during apricot blossom

Every year, thousands of amphibians are killed on Austria's roads. Amphibian protection measures are widely available, but need to be installed in time for migration. The University of Natural Resources and Life Sciences Vienna (BOKU), the Central Institute for Meteorology and Geodynamics (ZAMG), the Austrian Society for Nature Conservation and the Natural History Museum Vienna set the goal to better predict the start of amphibian migrations. The analysis of more than 11,500 observations over 18 years shows that the flowering dates of apricot and goat willow are good predictors of amphibian migration and can thus provide the starting signal for conservation measures.
Predicting amphibian migration - why is it important?
In order to mitigate the danger of roads for amphibians during their seasonal migration, temporary protection measures are used in Austria in addition to permanent facilities (so-called amphibian tunnels). For this purpose, protective fences are usually erected by volunteers along particularly endangered road sections and checked every day to see if there are any animals on site. Each animal is carried across the road by hand and released there. The challenge here is that the amphibian migration is weather-dependent and starts at different times each year, and the fences must be in place well in advance of the start of the migration. If the migration starts earlier than expected this means more amphibians killed, if the amphibian migration starts later than expected this means unnecessarily spent man hours for the volunteers.
What do plants have to do with amphibians?
At first glance, amphibian migration has nothing to do with plants, but: amphibian migration is influenced primarily by temperature and day length, just like the flowering and leaf unfolding of plants. A team of researchers from the Institute of Zoology at BOKU Vienna, ZAMG, the Austrian Society for Nature Conservation and the Natural History Museum Vienna therefore analyzed the temporal occurrence of amphibian migration of grass frogs and common toads and the flowering and leaf development of seven plant species. For this, a unique dataset of a total of 11 569 observations from 18 years (2000-2018) from four Citizen Science projects was available.
This is what came out
According to statistical model calculations, the flowering of apricots and goat willows is particularly suitable for estimating the onset of grass frog migration. The earlier the apricot bloom the earlier the grass frog migration. In the years analyzed, the apricot flowered almost simultaneously with the grass frog migration, while the goat willow flowered about 20 days before. According to the model, the goat willow is also suitable for estimating the migration of the common toad.
Gernot Neuwirth of Naturschutzbund Österreich: "Currently, the start of amphibian migration is estimated mainly by personal experience of people involved - so predicting the start of grass frog amphibian migration with the easily recognizable and common apricot or goat willow bloom could be especially helpful for volunteers with limited experience and for regions without past values." Amphibian migration could thus be estimated without technical effort, and protective measures could be established in a timely manner.
Data from Citizen Science
These results and conclusions could only be achieved with the help of the large amount of data collected by volunteers in the Citizen Science projects naturbeobachtung.at, Roadkill, Herpetofauna and Phenowatch. "Citizen Science makes it possible to investigate complex scientific questions that require data over long periods of time and from large study areas," says Florian Heigl, head of the Roadkill project and coordinator of Österreich forscht: "We would like to take this opportunity to thank all Citizen Scientists who made this study possible and invite all interested parties to participate in Citizen Science projects and actively contribute to science."
Studie: https://www.nature.com/articles/s41598-021-00912-4
The four Citizen Science projects:
naturbeobachtung.at (naturschutzbund Österreich)
Phenowatch (Central Institute for Meteorology and Geodynamics Vienna) www.phenowatch.at
Roadkill (Citizen Science working group, Institute of Zoology) www.roadkill.at
Amphibians and Reptiles of Austria under Observation (Natural History Museum Vienna) nhm-wien.ac.at
Leisler's bat
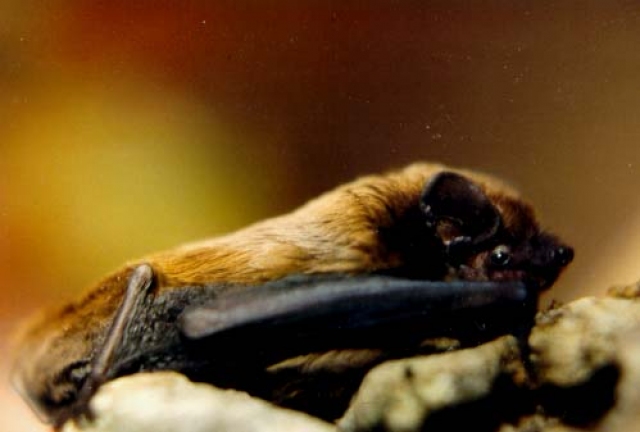
Description
The Leisler's bat is a medium-sized bat with a snout-vent length of 48 to 72 mm and a tail of 35 to 48 mm in length. The wingspan is 26 to 34 cm with an underarm length of 39 to 47 mm. Compared to the common noctule (Nyctalus noctula), it is clearly smaller, although particularly large females come close to especially small representatives of the common noctule with a minimum forearm length of 48 mm. Body weight is between 8 and 20 g and females are usually slightly larger than males.
In its physique and appearance, the Leisler's bat largely corresponds to the common noctule and differs from the latter, apart from its body size, mainly by its distinctly bicoloured dorsal fur. This consists of bicoloured hairs, which are dark to blackish brown at the base and distinctly lighter at the tips. The yellow-brown belly of the animal is slightly lighter than the back. In May and August there is a seasonal change of coat, which is associated with a slight change in coat colour. In summer the dorsal coat tends to be dark reddish brown to mahogany, the reddish tinge disappears in winter and the coat becomes dark grey to dark brown, and the ventral side is also slightly greyer than in summer. Juveniles are dark grey in their first year of life.
The wings are comparatively long and narrow, as in other noctule bats. The patagium is densely furred along the back and arms. The tail protrudes about one to two mm from the uropatagium. The ears are broad and triangular at the base, the ear tips are rounded. They have a size of 11.2 to 16.5 mm. At the outer edge the auricle has four to five transverse folds. The tragus is short and mushroom-shaped and thus corresponds to that of other noctule bats. Compared to the common noctule, the snout is conspicuously pointed with a slanted mouth.
Habitat
The species prefers open forests as habitat and is considered a typical forest bat. It uses deciduous forests as well as mixed and various coniferous forests as habitat. The habitats differ regionally in their forest composition; in Austria, for example, the bat prefers mainly mixed oak forests, while in other areas it is found in forests with a high proportion of beech, spruce and fir. The possible habitats are also diverse in terms of management form and range from structurally rich plenter forests to simple old-growth forests. The Leisler's bat needs tree hollows both as a nursery roost and as a winter habitat and therefore occurs most frequently in forest stands with a high proportion of older trees; alternatively, artificial roosts such as bat boxes or bird nesting boxes can also increase its attractiveness.
Hunting areas are pastures close to forests, water areas and rivers. Occasionally, the Leisler's bat is also found in towns and even in larger cities. In cities, its roosts are mostly in parks and only rarely in buildings.
The text is a translation of an excerpt from Wikipedia (https://de.wikipedia.org/wiki/Kleiner_Abendsegler). On wikipedia the text is available under a „Creative Commons Attribution/Share Alike“ licence. Status: 13 August 2021
5. Publikation
Was lernen wir aus den weltweit unterschiedlichen Roadkill Projekten? Hier ist unser Blogpost auf Österreich forscht zu unserer neuen Publikation für euch: https://www.citizen-science.at/blog/was-lernen-wir-aus-den-weltweit-unterschiedlichsten-roadkill-meldesystemen
Fifth scientific article published
Together with colleagues from the USA, South Africa, the Czech Republic, Belgium, Great Britain and Canada we looked at 15 different roadkill projects and compared them with each other.
The idea behind it was not of a purely academic nature, but was very practical. We wanted to find out how the different projects work, who can take part, what data is collected and what consequences result from it. Based on the results, we would like to try whether it would be possible to link all these projects together to create a global roadkill reporting system. Such an approach would make it possible to show even more clearly the impact of road traffic on biodiversity.
If you would like to know more about the recommendations that have been developed for similar projects and how the projects developed for public authorities or for road maintenance companies differ, you are welcome to read the original article that we have linked at the end of the blog.
Abstract:
Globally, wildlife-vehicle conflict (WVC) fragments wildlife populations (due to road/traffic-aversion), kills and injures individual animals, can cause wildlife population declines, may eventually contribute to local or total extinction of certain species, and can harm vehicles and drivers. Preventing WVC begins with recording locations of conflict, such as vehicle crashes, animal carcasses (roadkill), or animal behavior around roads, such as avoidance of roads or crossing-behavior. These data are ideally used to inform transportation policy and planning and to retrofit roadways and their structures to reduce WVC. We are collectively involved with or manage eight regional or national systems for reporting WVC in collaboration with volunteers and/or agency staff. In this review, we survey systems for recording WVC by volunteers and agency staff at different geographical scales, based on existing literature and our personal experience. We report the range of data collection methods, data management systems and data visualizations employed as well as discuss the groups and type of volunteers and agencies involved. We use our expertise and the global survey to provide methodological specifications based on current best-practice for collecting and using WVC data to inform transportation and conservation decisions. We conclude with a vision of next steps toward a global network of WVC reporting systems, that have clear and practical applications for improved conservation research as well as guidelines for management of road networks.
Unfortunately we could not afford to pay the $3000 for a free-access publication, but we got permission from the publisher to publish a so-called "pre-print" version of the article. This means that under the following link you can read a version of the article, which still contains a few small typos, but otherwise has the same content as the original article: https://zenodo.org/record/4276898
If you have any questions regarding this article, please feel free to post them in our blog post on Österreich forscht in the comments.